Data Graphics

Design Patterns

Example Color Schemes

Related Work

EOS End of the Rainbow
Articles


Color Schemes Appropriate for Scientific Data Graphics

Color Schemes:  Diverging - Sequential - Categorical - Other


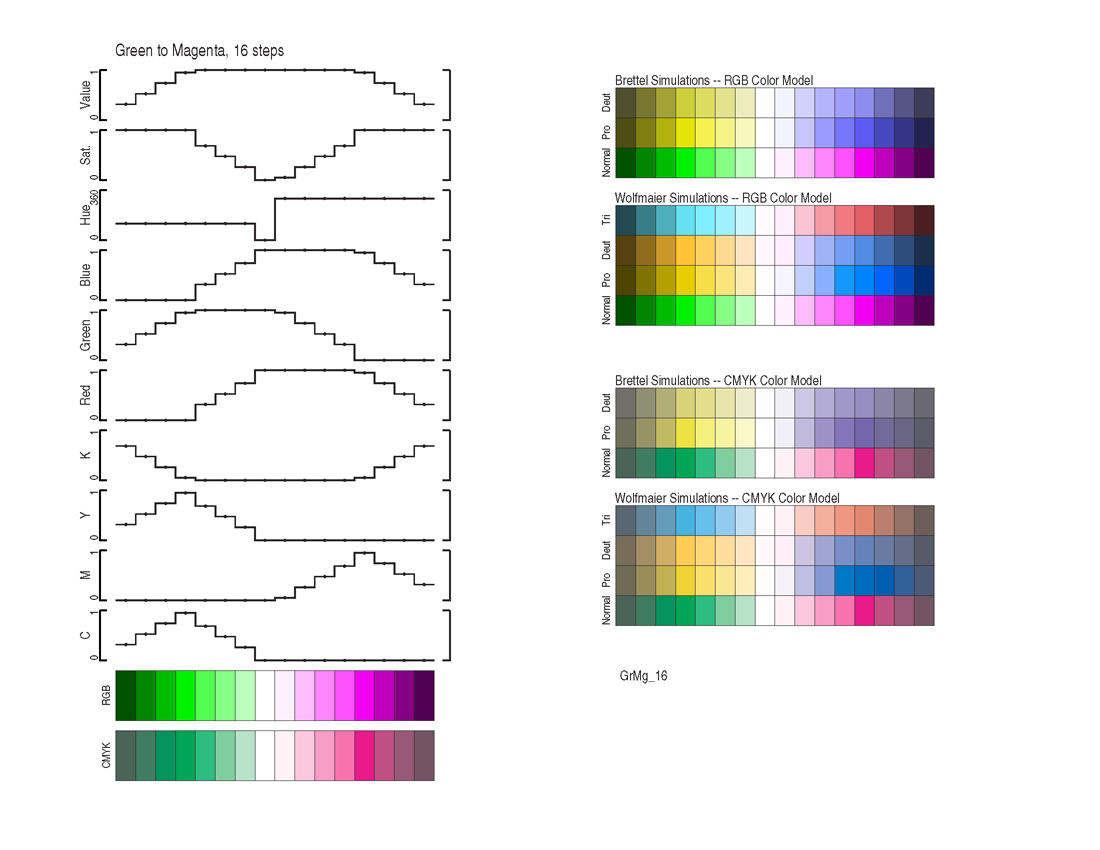
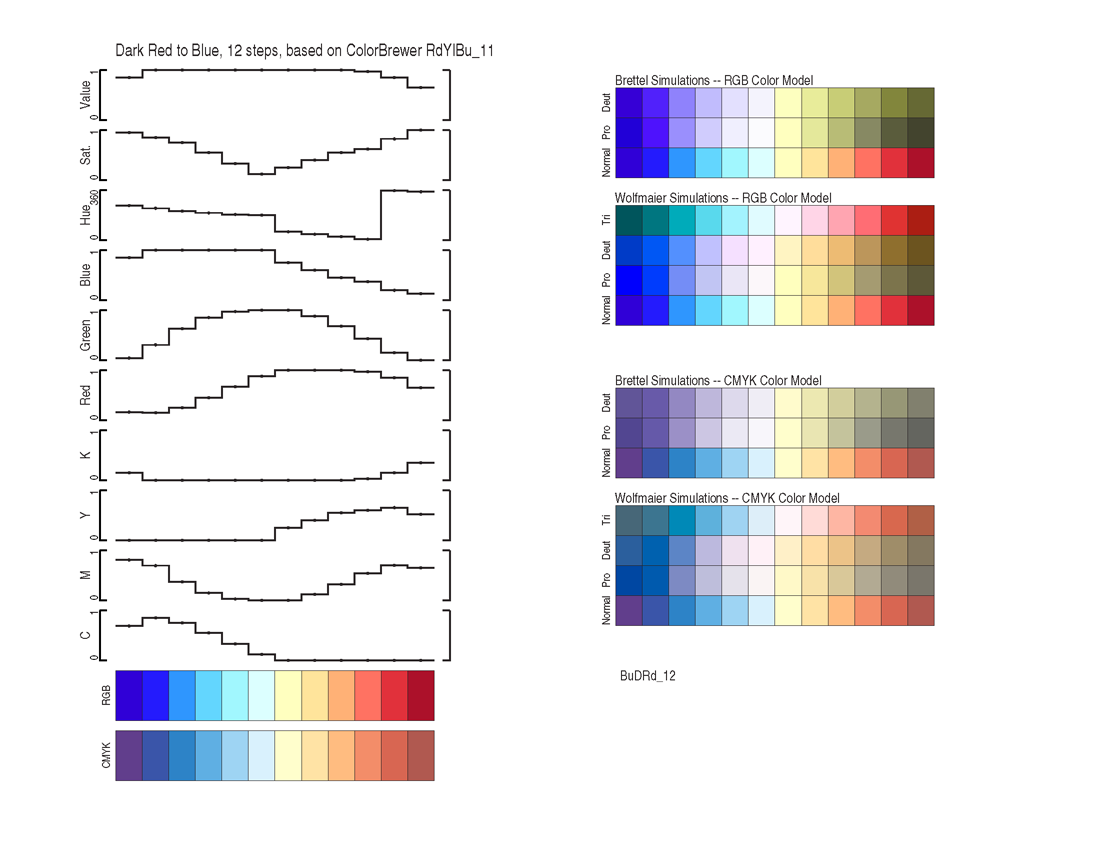
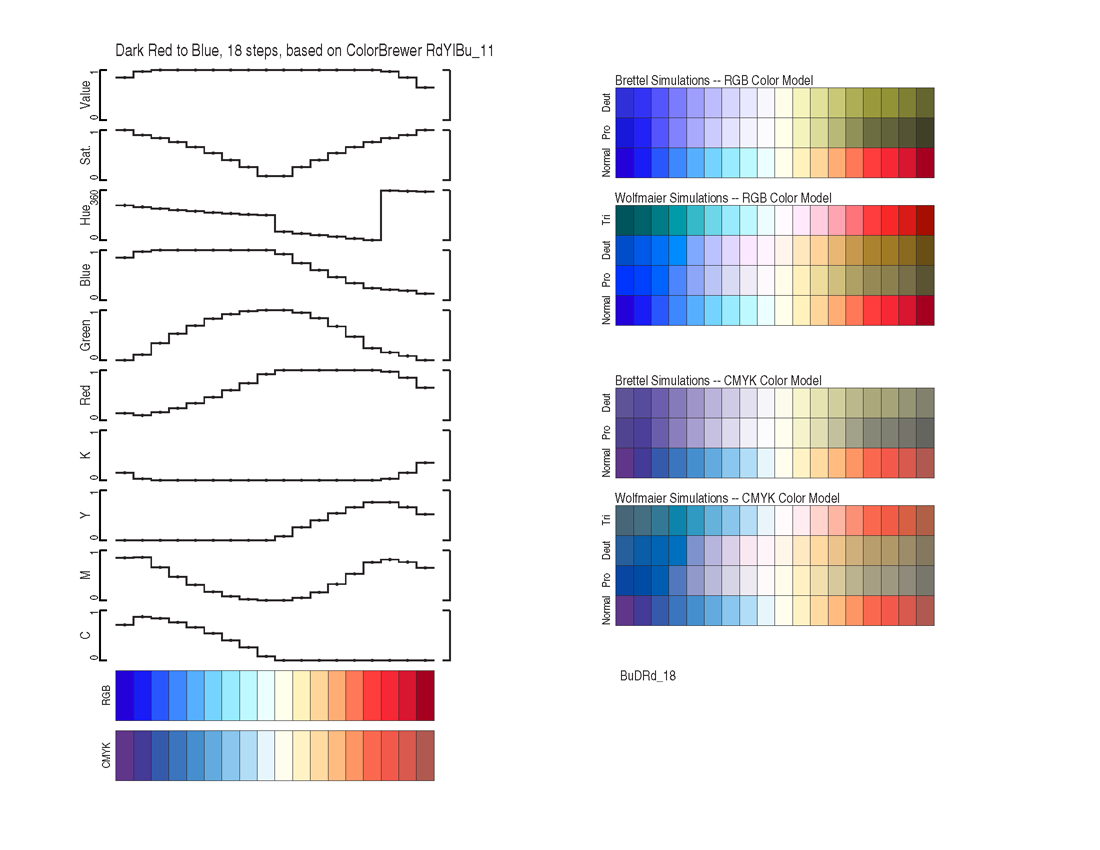
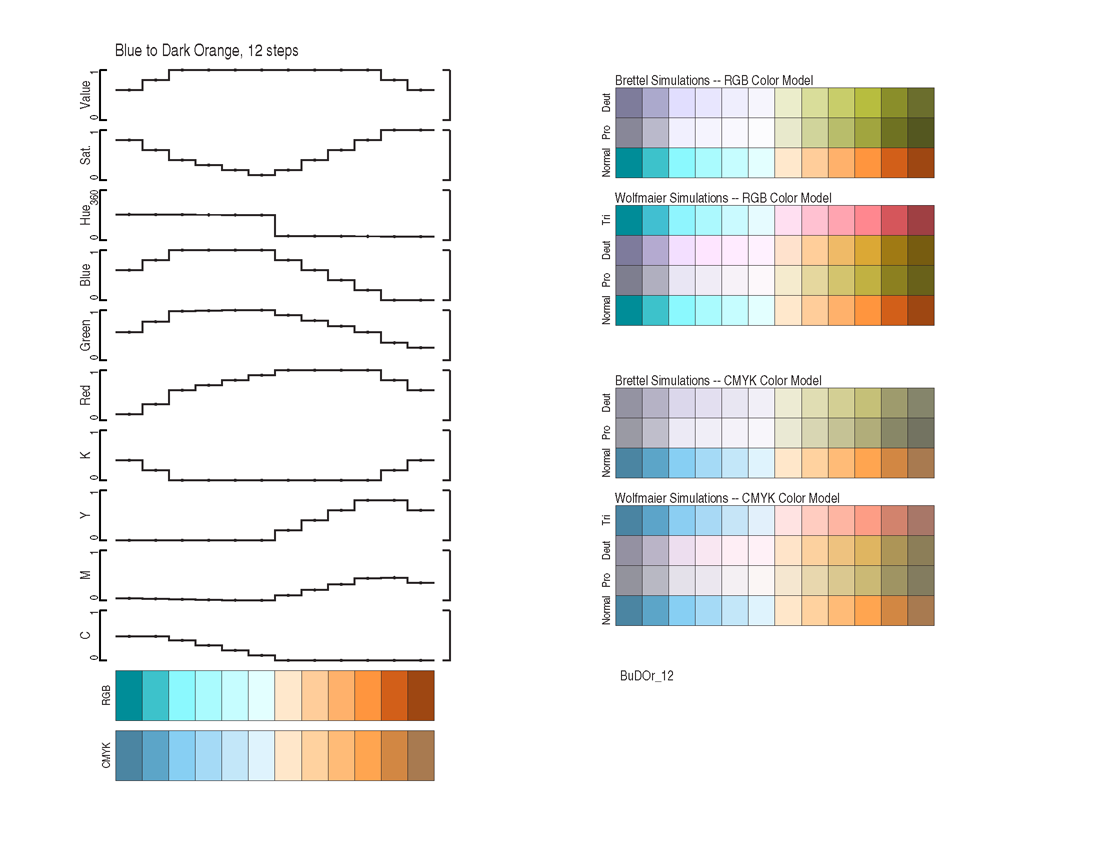
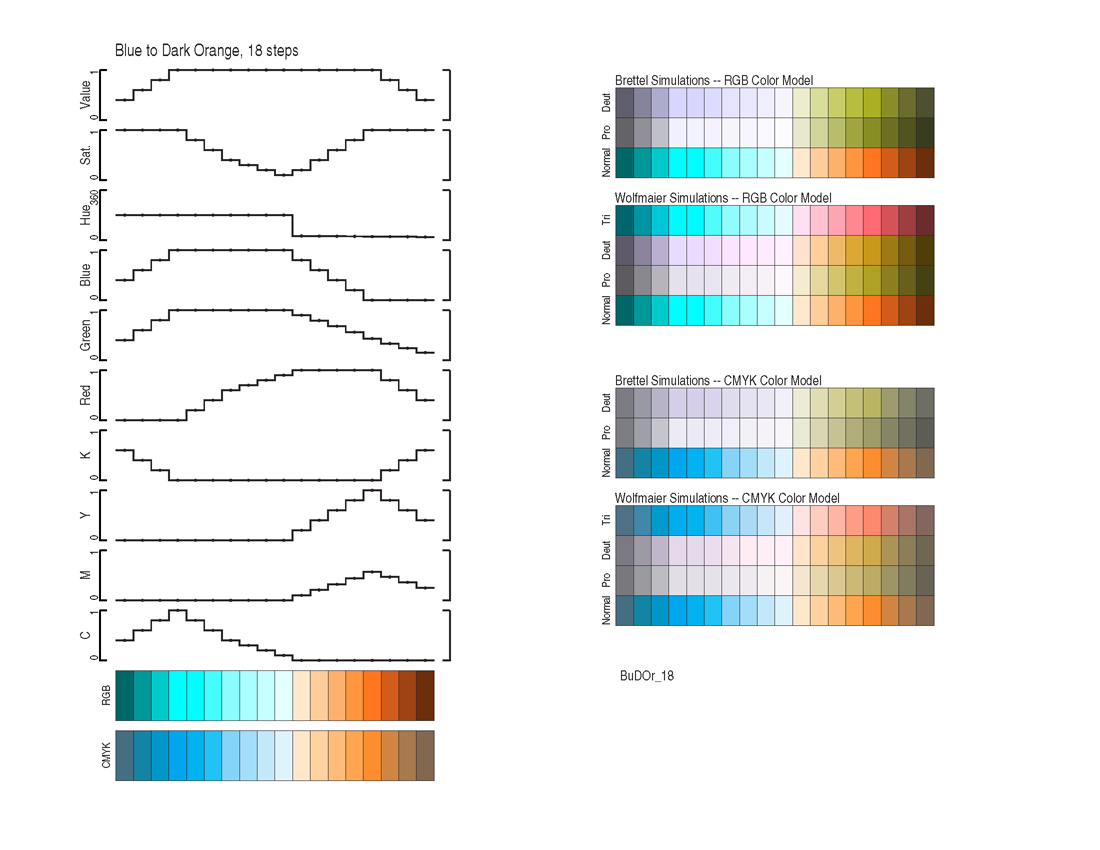
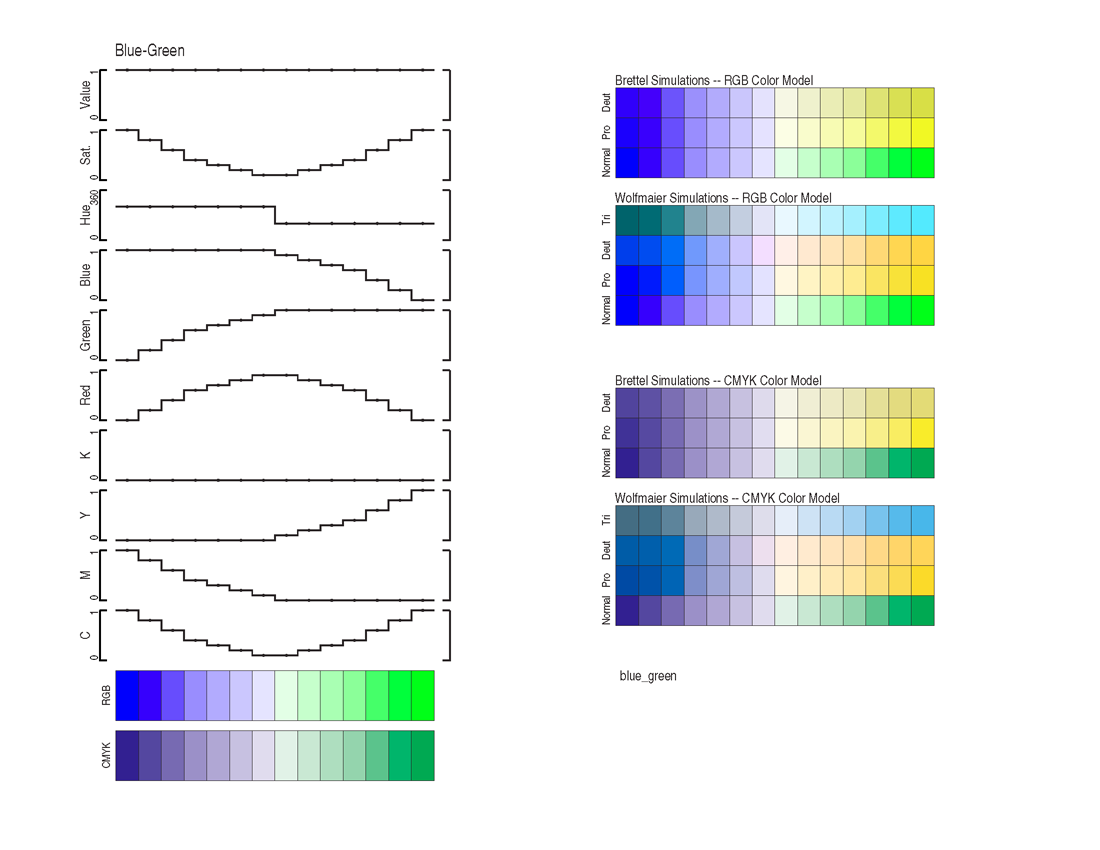
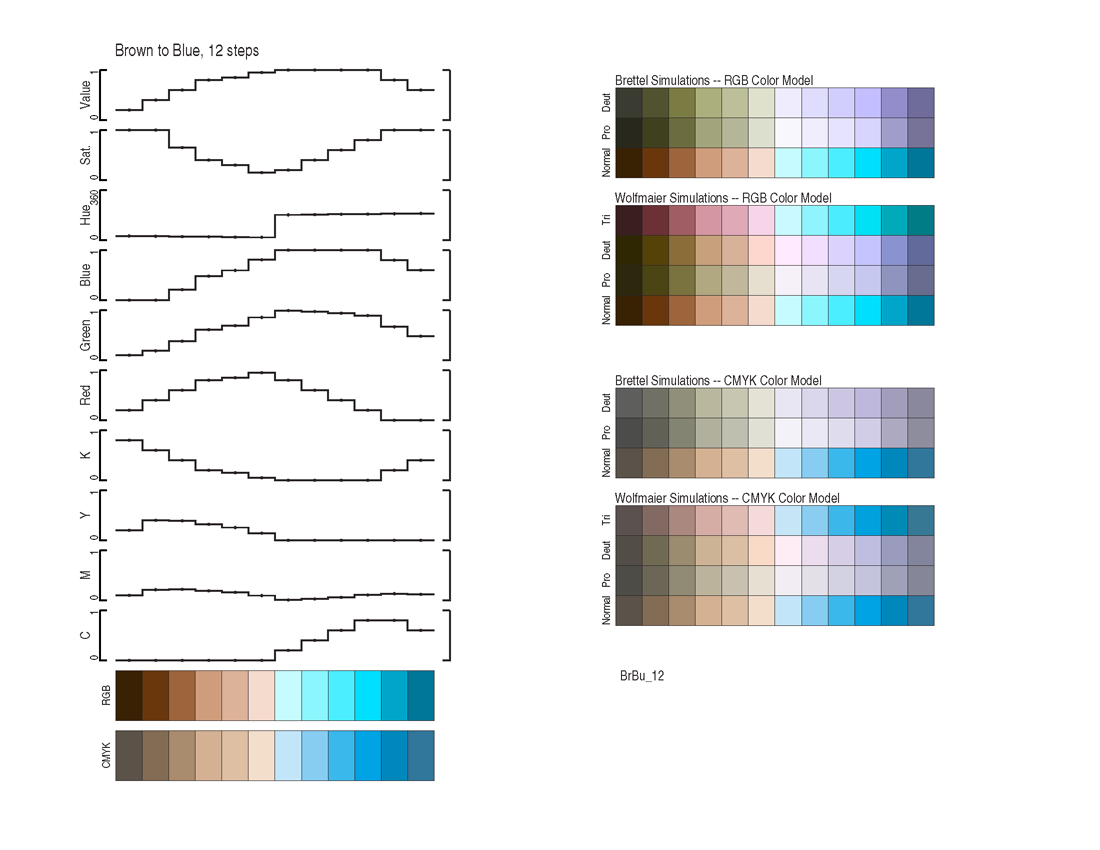
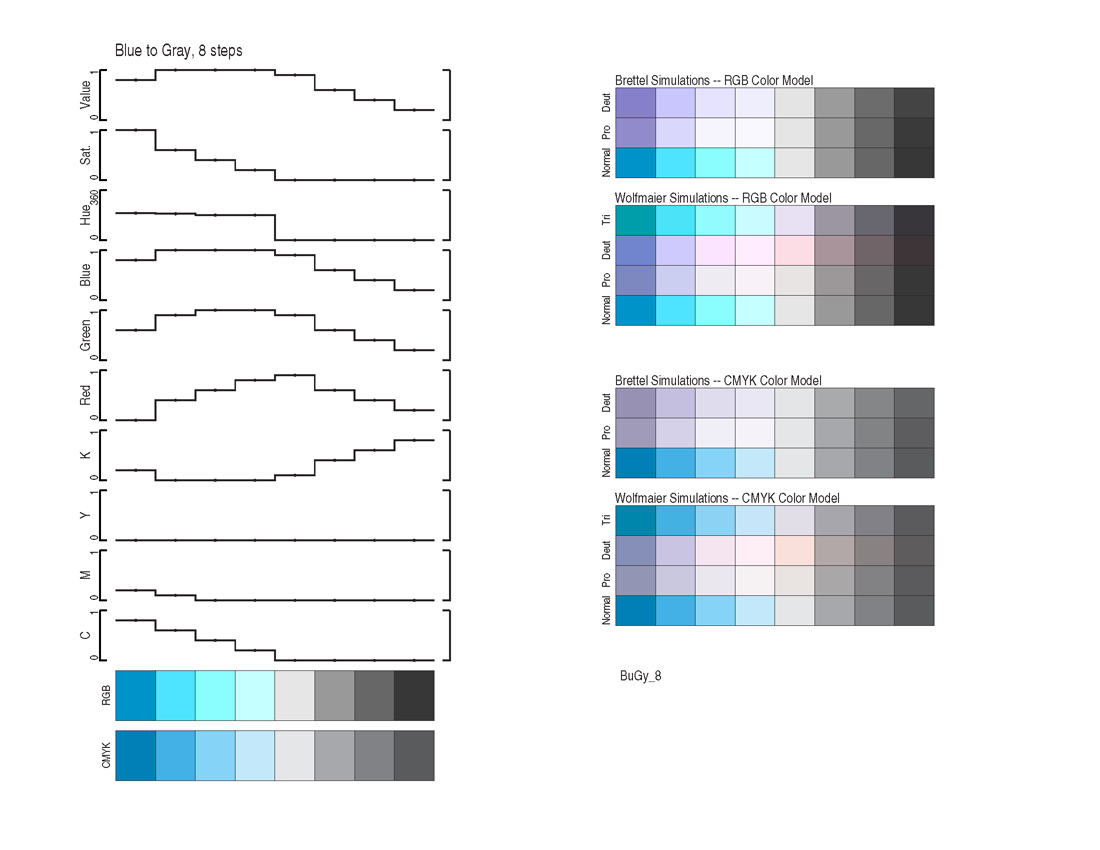
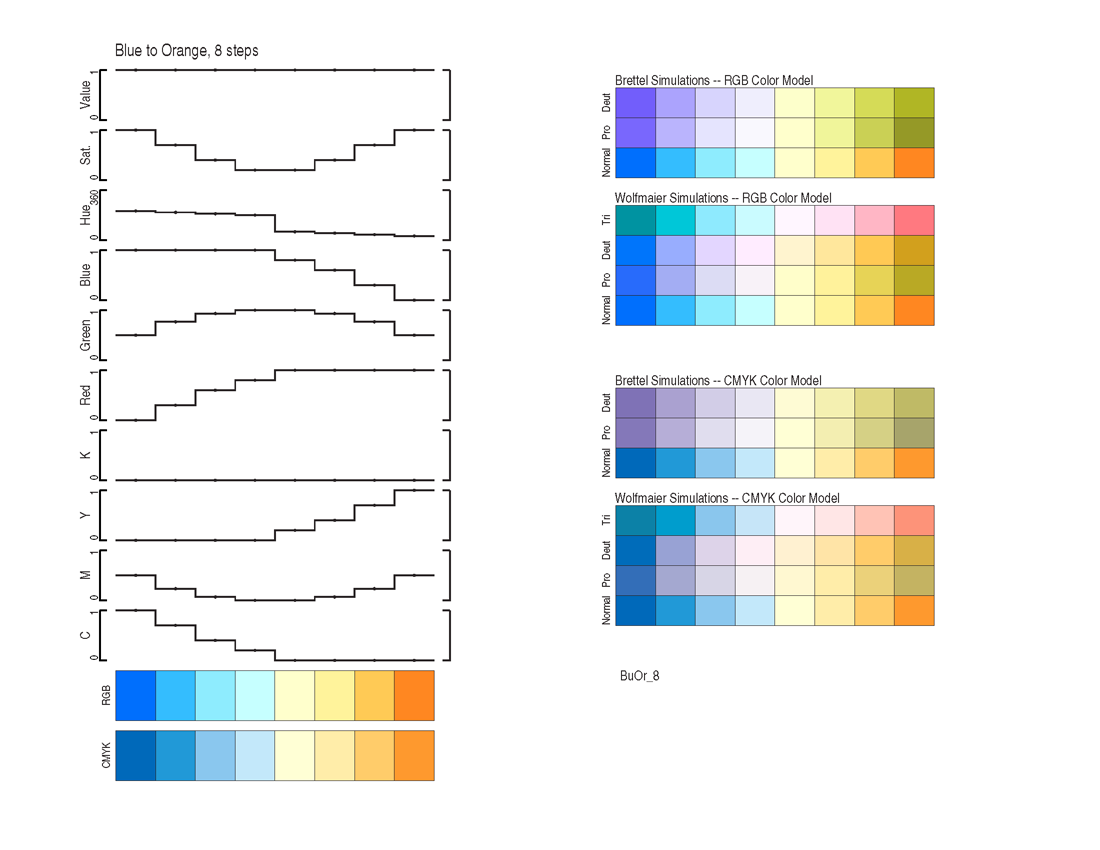
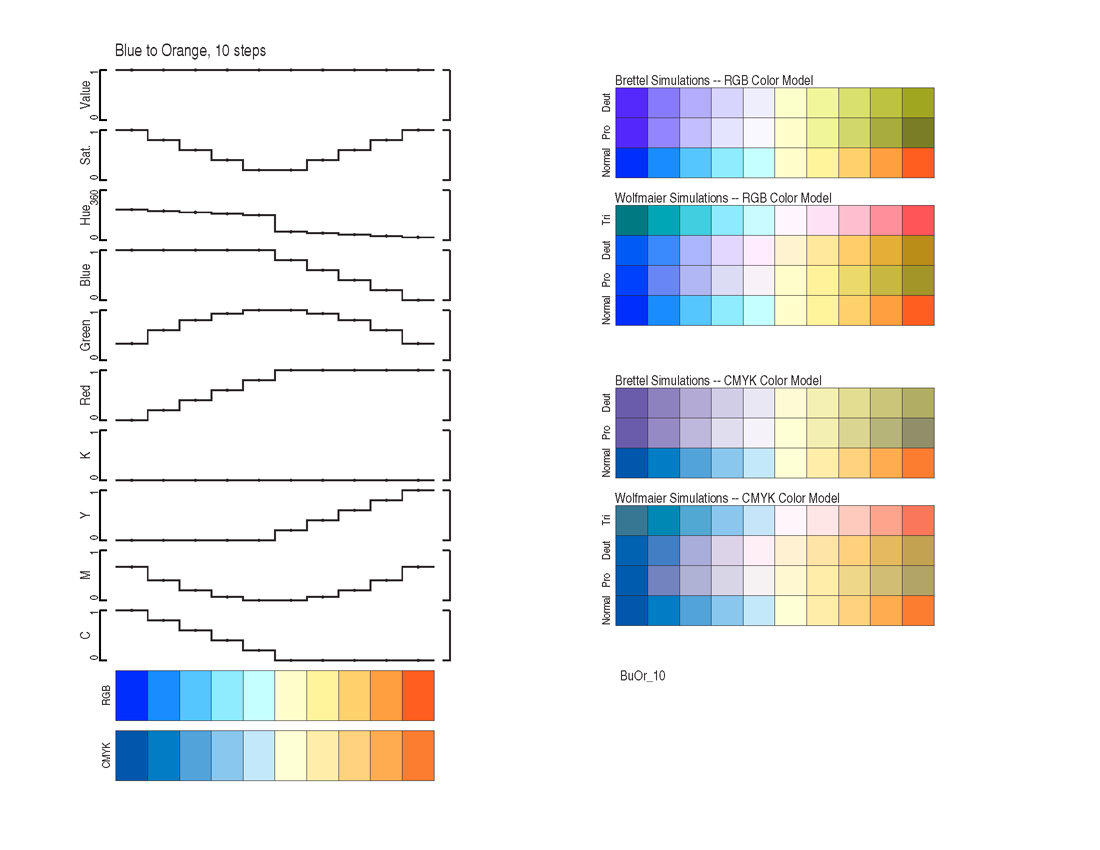
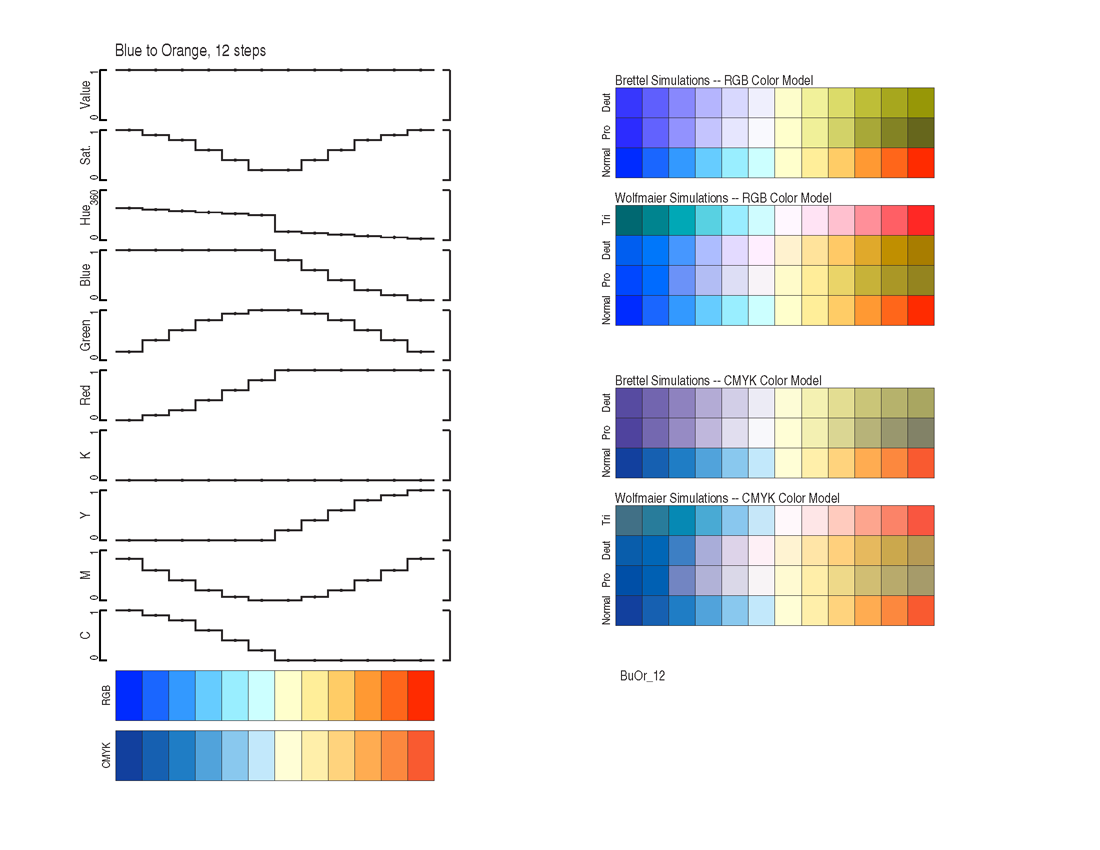
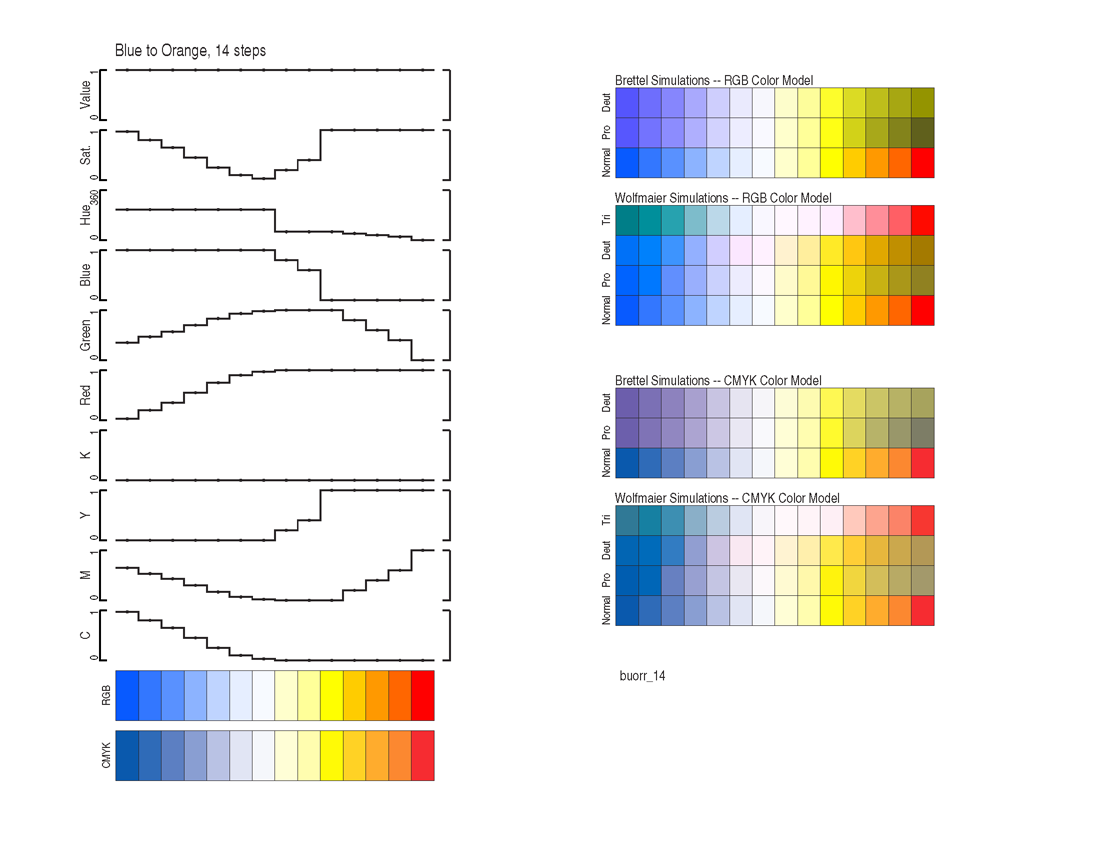
Diverging Color Schemes

Green-to-Magenta, 16 Steps
Useful for generic diverging data.  Colors can be differentiated by color-deficient viewers.
Color number text file    .pdf of color chart    .png of color chart
 
Blue-to-Dark Red, 12 Steps
Useful for temperature-like data, with a subjective interpretation (blue=cold, red=hot)
Color number text file    .pdf of color chart    .png of color chart
 
Blue-to-Dark Red, 18 Steps
Useful for temperature-like data.
Color number text file    .pdf of color chart    .png of color chart
 
Blue-to-Dark Orange, 12 Steps
Useful for data without a specific subjective color association.
Color number text file    .pdf of color chart    .png of color chart
 
Blue-to-Dark Orange, 18 Steps
Useful for data without a specific subjective color association.
Color number text file    .pdf of color chart    .png of color chart
 
Blue-to-Green, 14 Steps
Useful for data with a winter (blue) vs. summer (green) association.
Color number text file    .pdf of color chart    .png of color chart
 
Brown-to-Blue, 10 Steps
Useful for data with a dry (brown) vs. wet (blue) association.
Color number text file    .pdf of color chart    .png of color chart
 
Brown-to-Blue, 12 Steps
Useful for data with a dry (brown) vs. wet (blue) association.
Color number text file    .pdf of color chart    .png of color chart
 
Blue-to-Grey, 8 Steps
Useful in particular for diverging data like cloudiness anomalies.
Color number text file    .pdf of color chart    .png of color chart
 
Blue-to-Orange, 8 Steps
Useful for data like sea-level pressure, with ansubjective association (blue=low, wet, orange=high, dry) 
Color number text file    .pdf of color chart    .png of color chart
 
Blue-to-Orange, 10 Steps
As above, with more class intervals.
Color number text file    .pdf of color chart    .png of color chart
 
Blue-to-Orange, 12 Steps
As above, with more class intervals.
Color number text file    .pdf of color chart    .png of color chart
 
Blue-to-Orange Red, 14 Steps
Useful as an alternative to the red/blue temperature scale.
 
Color number text file    .pdf of color chart    .png of color chart
 
Modified Spectral Scheme, 11 Steps
An alternative to the spectral scheme (no green)
 
Color number text file    .pdf of color chart    .png of color chart
 

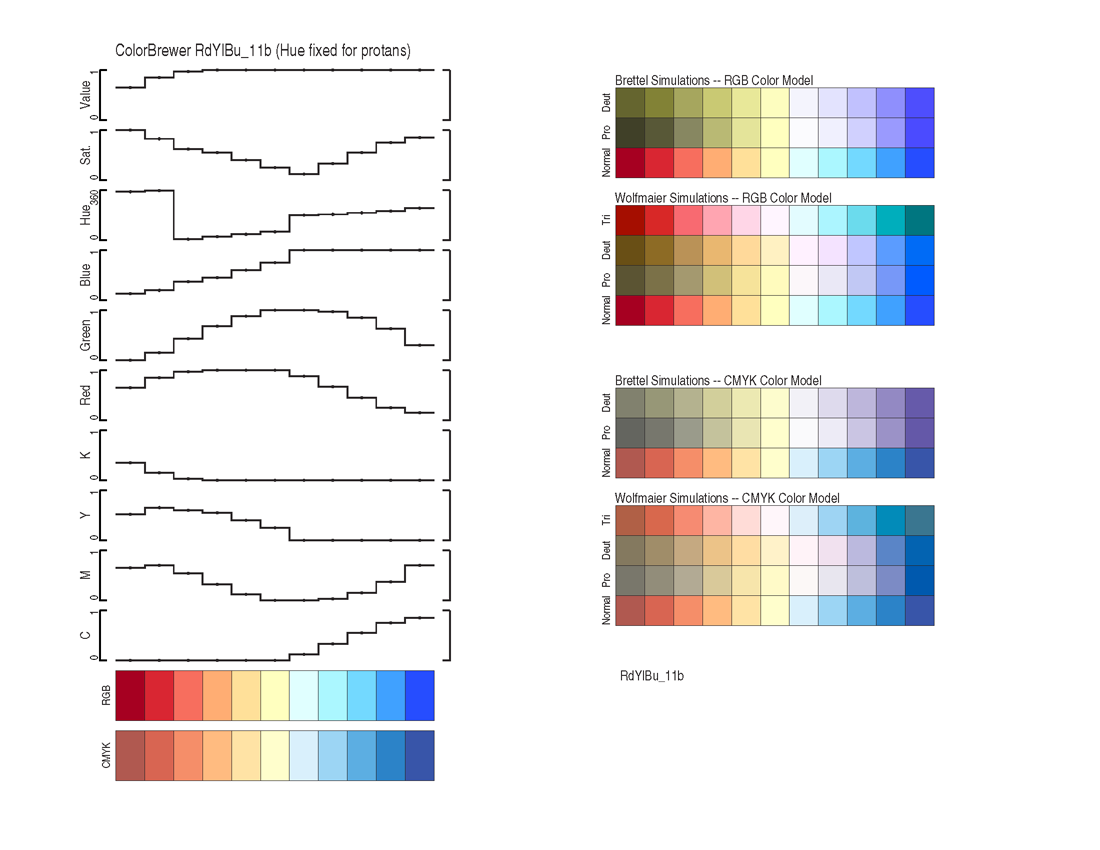
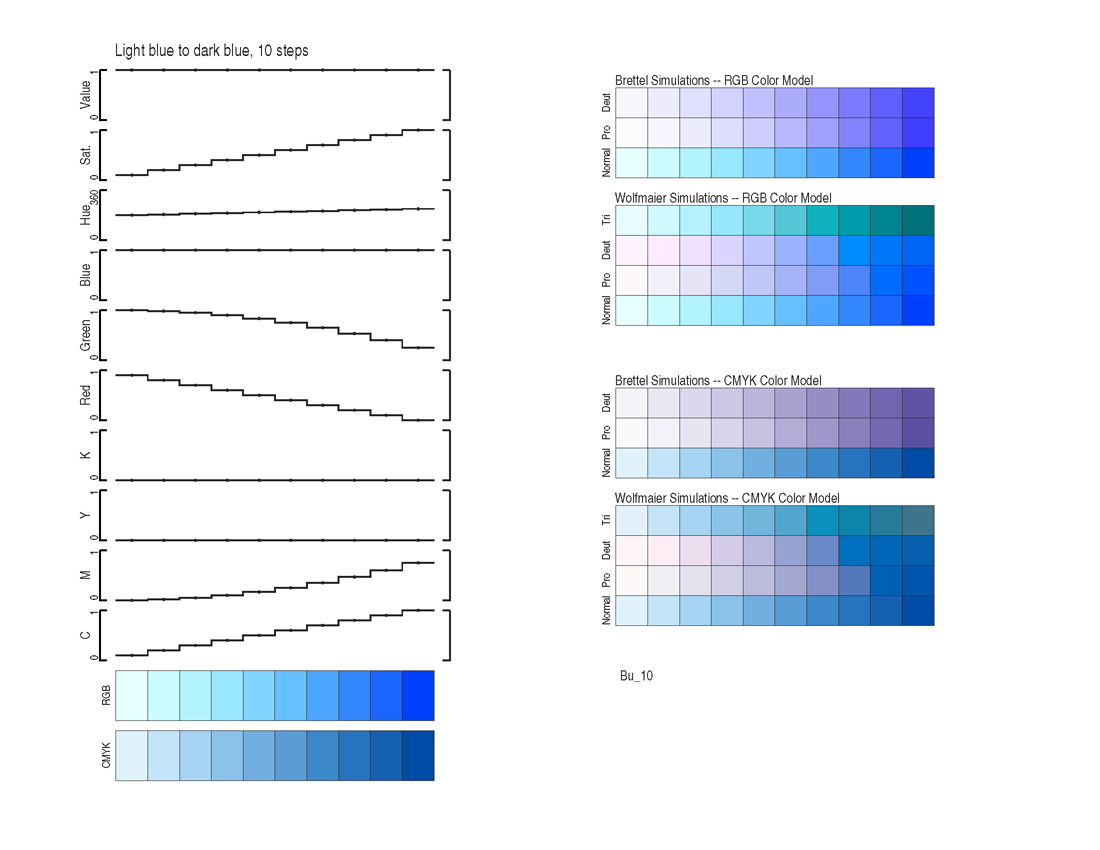
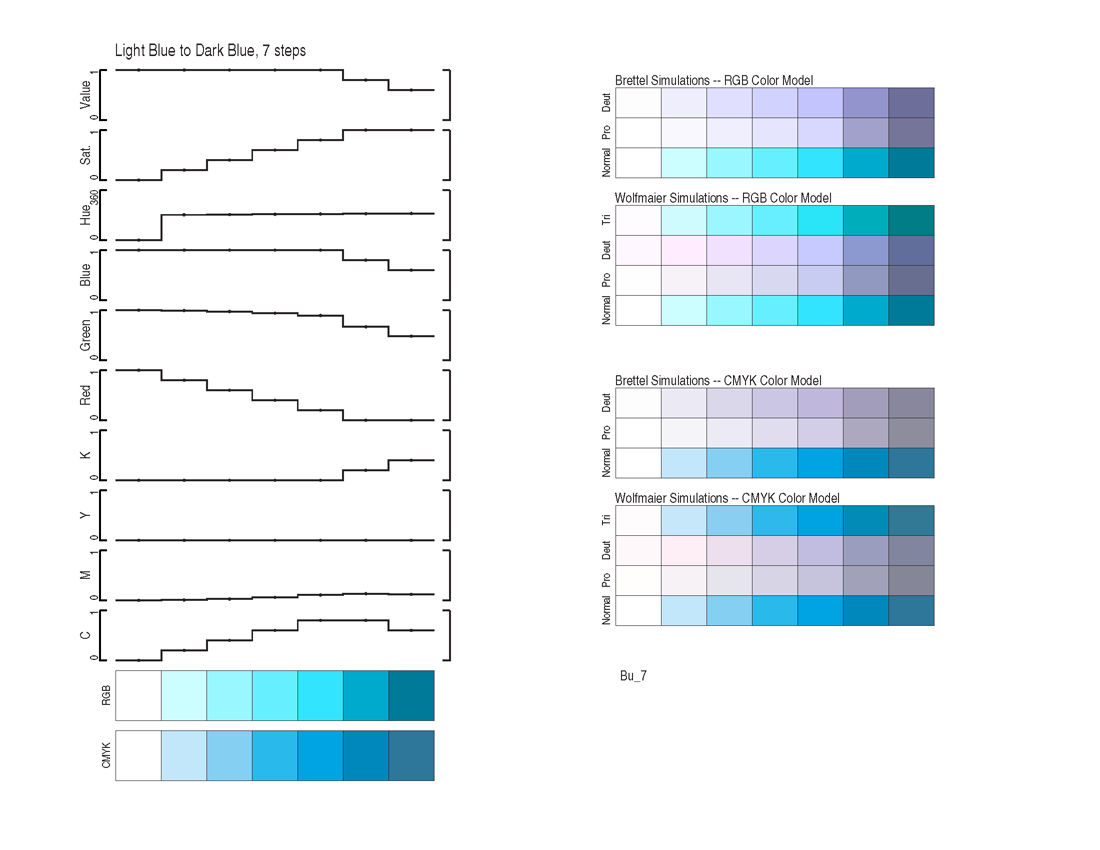
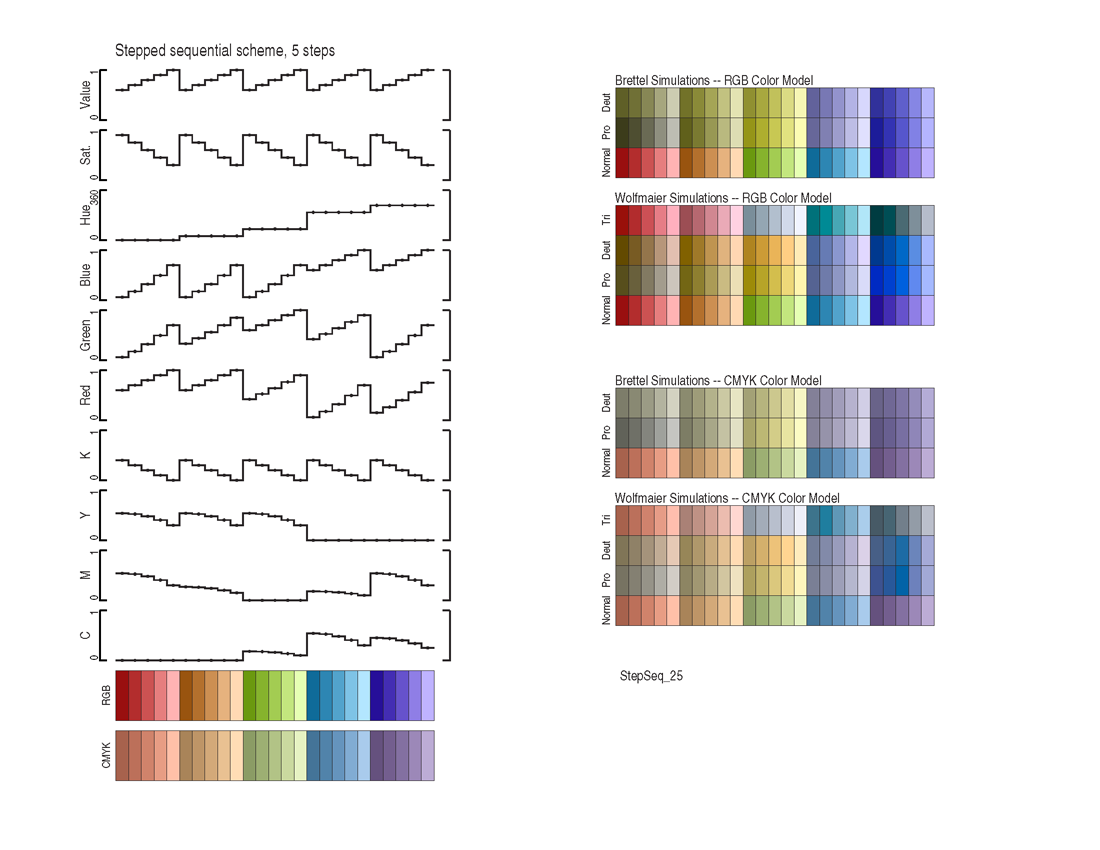
Sequential Color Schemes

Light Blue-to-Dark Blue, 10 Steps
Useful for precipitation-like data.
Color number text file    .pdf of color chart    .png of color chart
 
Light Blue-to-Dark Blue, 7 Steps
As above, with fewer class intervals.
Color number text file    .pdf of color chart    .png of color chart
 

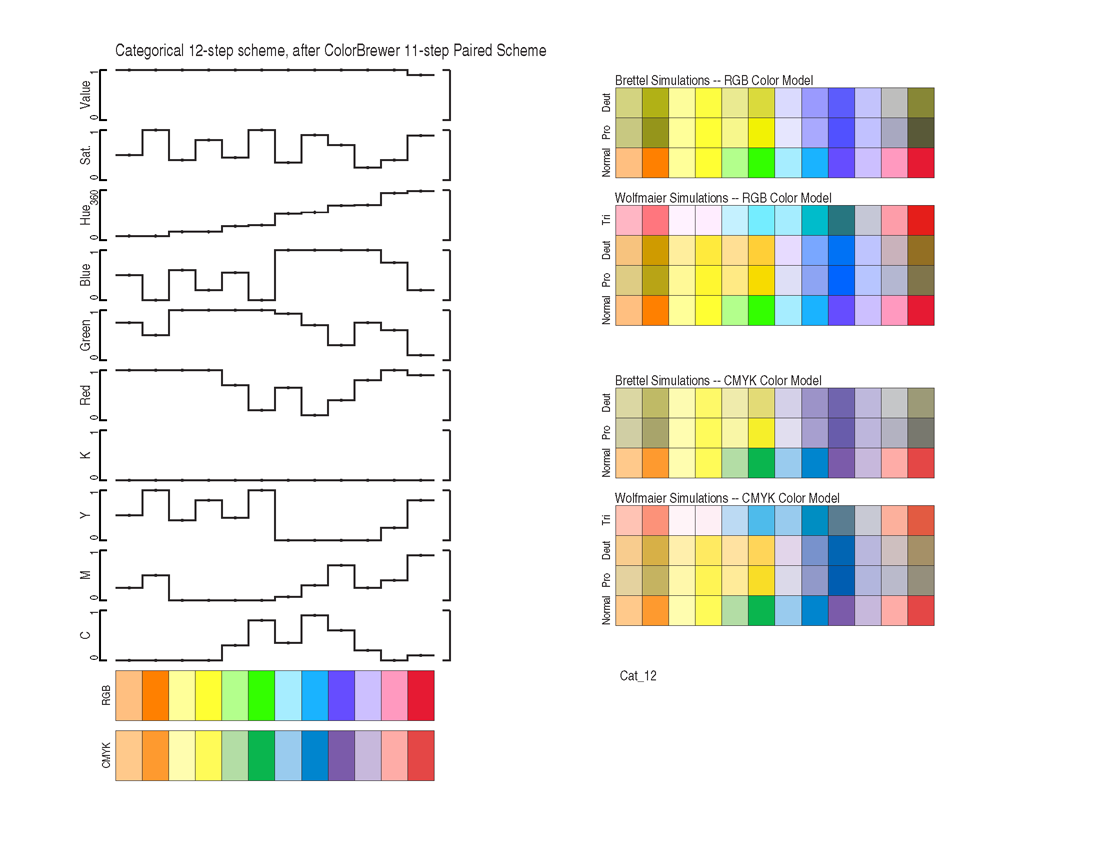
Categorical Color Schemes

Paired-color categorical, 12 Steps
Attempt at a categorical color scale with colors that may be distinguishable to all viewers
Color number text file    • .pdf of color chart    • .png of color chart
 

Other Schemes

Stepped-sequential scheme, 5 hues x 5 saturation/value levels
Useful for portraying levels-within-categories
Color number text file    • .pdf of color chart    • .png of color chart
 

Simulations of the appearance of the color schemes to color-deficient viewers were based on algorithms in

  • Designing for the Color-Challenged: A Challenge
    T.G. Wolfmaier, Internetworking 2.1 (Internet Technical Group Newsletter) March 1999
    http://www.internettg.org/newsletter/mar99/accessibility_color_challenged.html
    Thomas Wolfmaier's discussion of the issues arising in designing for color-deficient viewers.  Includes a Java application demonstrating the simulation of how different kinds of color-deficient viewers may perceive particular colors specified by the user.

  • Java Applets on Colour Vision Deficiencies
    http://www.tsi.enst.fr/~brettel/
    Hans Brettel's applets for simulation the appearance of colors to color-deficient viewers.  See also H. Brettel, F. Viénot, and J. D. Mollon (1997) Computerized simulation of color appearance for dichromats. Journal of the Optical Society of America 14:2647-2655.

The categorical color scheme above, as well as inspiration for some of the other schemes, comes from

  • ColorBrewer
    http://www.personal.psu.edu/faculty/c/a/cab38/ColorBrewerBeta2.html
    Cindy Brewer's web application that demonstrates sequential, diverging, and qualitative color schemes (and provides the specifications of those schemes in several different color spaces).  See also:  Brewer, C.A., G.W. Hatchard, and M.A. Harrower, (2003), Colorbrewer in print: A catalog of color schemes for maps, Cartography and Geographic Information Science, 30, 5-32 (http://www.ColorBrewer.org).


Department of Geography, University of Oregon
last modified 02/12/2007 10:42 PM